河南农业科学 ›› 2022, Vol. 51 ›› Issue (6): 43-53.DOI: 10.15933/j.cnki.1004-3268.2022.06.005

所属专题: 种质资源评价与筛选

• 作物栽培·遗传育种 • 上一篇    下一篇

谷子农艺性状与蛋白质含量相关性分析

冯链1,田翔2,乔治军2,王海岗2   

  1. (1.山西农业大学农学院,山西 太原 030031;2.山西农业大学农业基因资源研究中心,山西 太原 030031)
  • 收稿日期:2022-03-18 出版日期:2022-06-15 发布日期:2022-08-15
  • 通讯作者: 王海岗(1981-),男,山西平定人,副研究员,主要从事谷子糜子种质资源保护与利用研究。E-mail:nkywhg@126.com
  • 作者简介:冯链(1997-),女,陕西安康人,在读硕士研究生,研究方向:种质创新与遗传工程。E-mail:723348121@qq.com
  • 基金资助:
    山西农业大学生物育种工程项目(YZGC149);山西农业大学博士科研启动项目(2021BQ37);国家现代农业产业技术体系项
    目(CARS-06-14.5-A16)

Correlation Analysis between Protein Content and Agronomic Traits of Foxtail Millet

FENG Lian1,TIAN Xiang2,QIAO Zhijun2,WANG Haigang2   

  1. (1.College of Agronomy,Shanxi Agricultural University,Taiyuan 030031,China;2.Agricultural Genetic Resources Research Center,Shanxi Agricultural University,Taiyuan 030031,China)
  • Received:2022-03-18 Published:2022-06-15 Online:2022-08-15

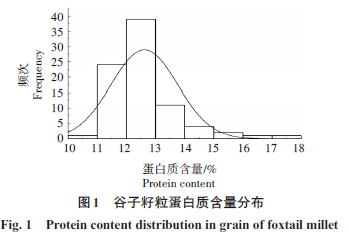
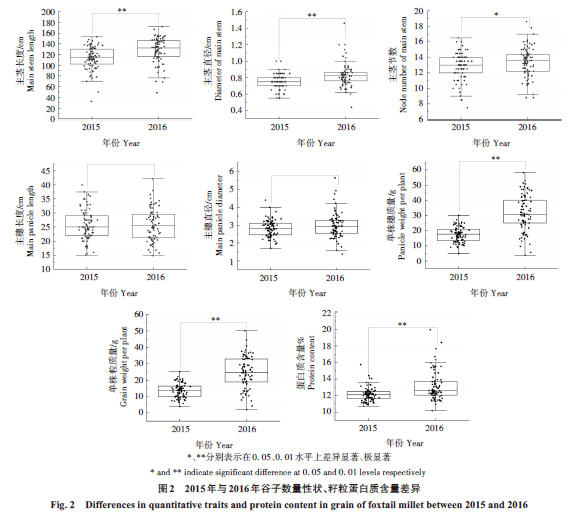
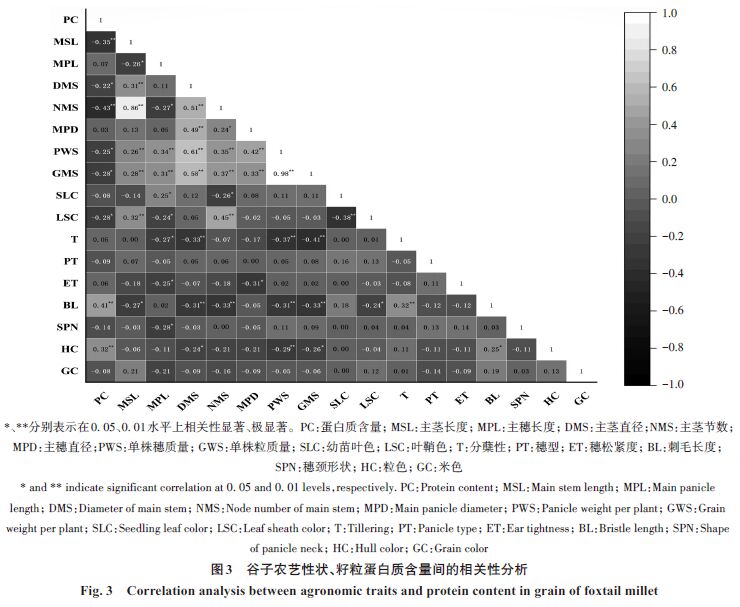
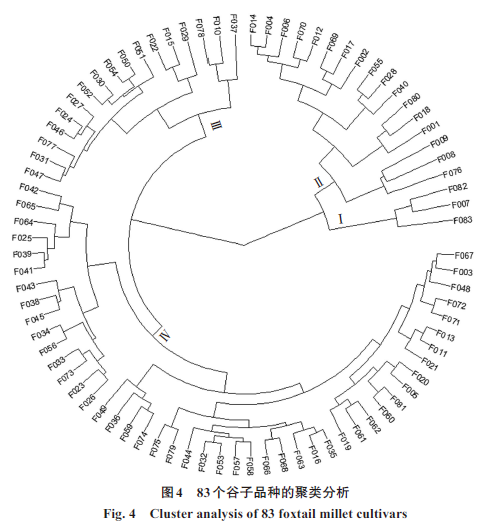
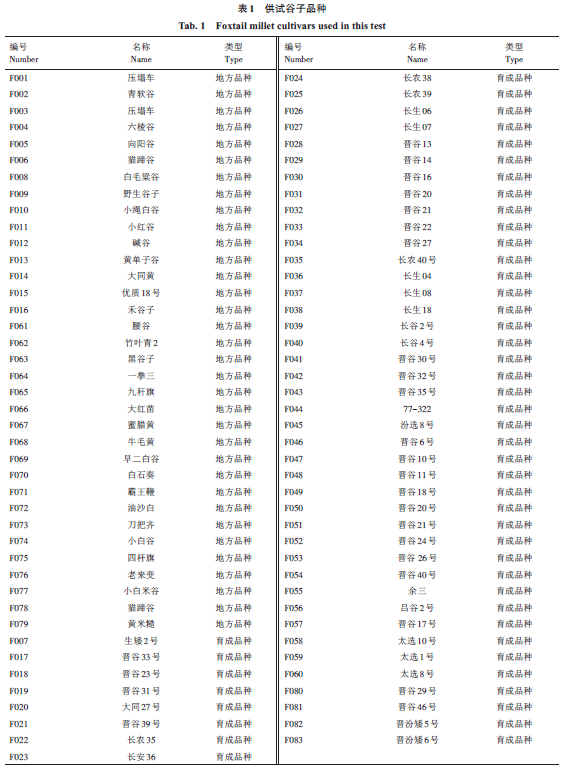
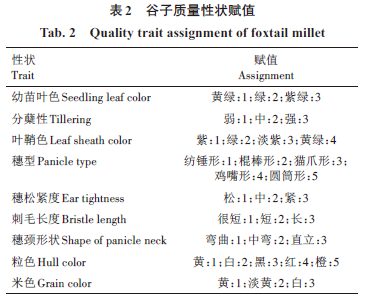
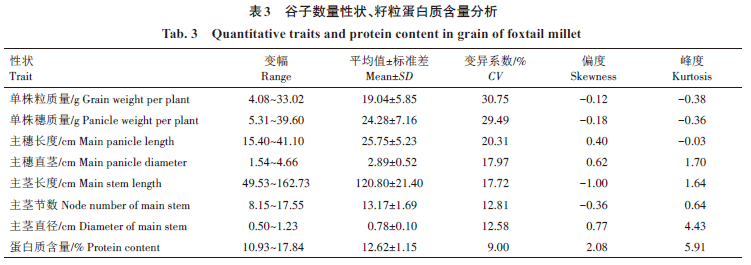
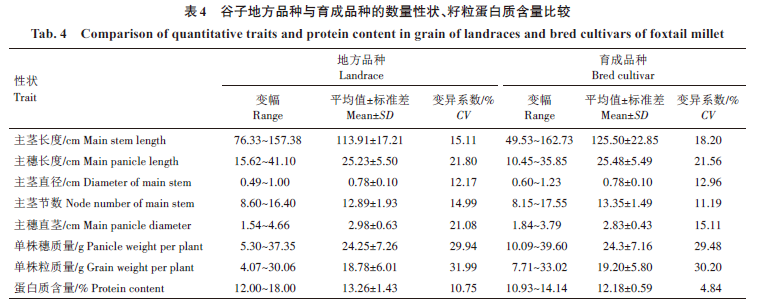
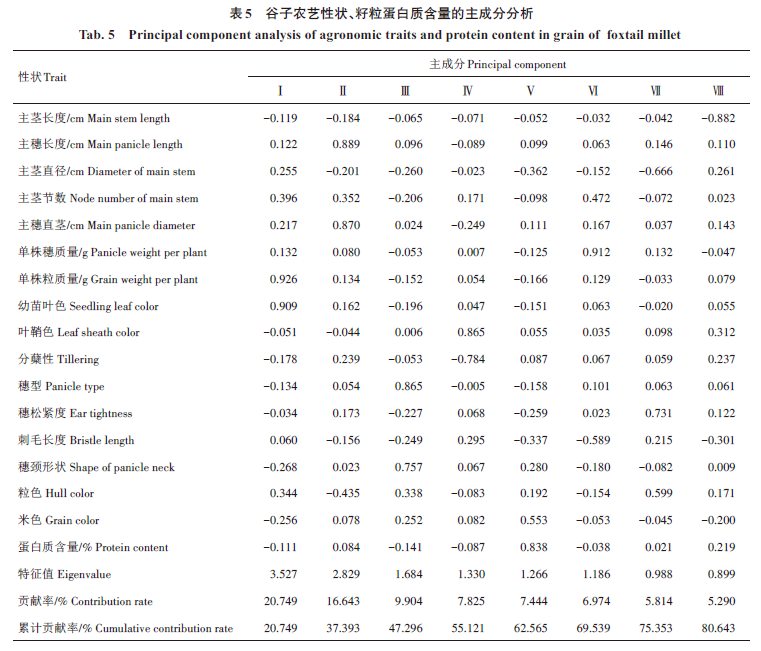
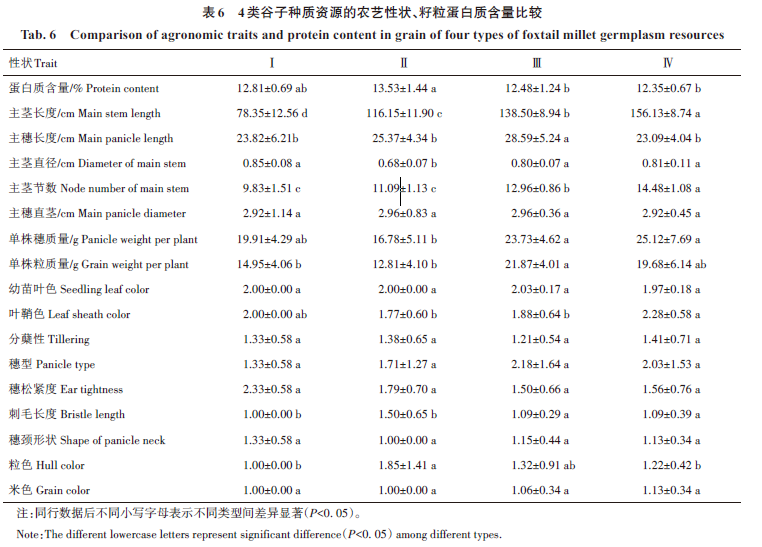
摘要: 对山西省83个谷子地方品种和育成品种的农艺性状(质量性状:幼苗叶色、分蘖性、叶鞘色、穗型、穗松紧度、刺毛长度、穗颈形状、粒色、米色;数量性状:主茎长度、主穗长度、主茎直径、主茎节数、主穗直径、单株穗质量、单株粒质量)、籽粒蛋白质含量进行相关性分析,并对上述性状进行主成分分析和聚类分析,为谷子育种中高蛋白质种质的筛选提供依据。结果表明,谷子籽粒蛋白质含量变异系数最低,为9.00%,单株粒质量变异系数最高,为30.75%,具体表现为单株粒质量>单株穗质量>主穗长度>主穗直径>主茎长度>主茎节数>主茎直径>蛋白质含量。相关性分析结果表明,籽粒蛋白质含量与主茎长度、主茎节数呈极显著负相关,与主茎直径、单株穗质量、单株粒质量和叶鞘色呈显著负相关,与刺毛长度和粒色呈极显著正相关。主成分分析结果表明,前8个主成分的累计贡献率达80.643%,可用于表述谷子蛋白质含量和农艺性状的大部分信息。聚类分析结果表明,83个谷子品种可以分为4类,第Ⅰ类为育成品种,主要特征为主茎长度、主茎节数和刺毛长度最小,主茎直径最大,具有抗倒伏潜力;第Ⅱ类以地方品种为主,蛋白质含量最高;第Ⅲ类主穗长度和单株粒质量最高;第Ⅳ类以育成品种为主,主茎长度、主茎节数和单株穗质量最高。在高蛋白质谷子品种选育中,应注重对地方品种中主茎长度、单株穗质量和单株粒质量较小资源的深入研究和利用。

关键词: 谷子, 农艺性状, 蛋白质含量, 相关性分析

Abstract: The correlation between the agronomic traits(quality traits:seedling leaf color,tillering,leaf sheath color,panicle type,ear tightness,bristle length,shape of panicle neck,hull color,grain color;quantitative traits:main stem length,main panicle length,diameter of main stem,node number of main stem,main panicle diameter,panicle weight per plant,grain weight per plant)and grain protein content of 83 Shanxi foxtail millet cultivars including landraces and bred cultivars was studied,and principal component analysis and cluster analysis were done,so as to provide theoretical basis for the selection of germplasm with high protein content in millet breeding.The results showed that the variation coefficient of grain protein content of foxtail millet was the lowest(9.00%),whereas the variation coefficient of grain weight per plant was the highest(30.75%).The order of variation coefficient of all the quantitative traits was grain weight per plant>panicle weight per plant>main panicle length>main panicle diameter>main stem length>node number of main stem>diameter of main stem>protein content.Correlation analysis result showed that grain protein content was significantly negatively correlated with main stem length,node number of main stem,main stem diameter,panicle weight per plant,grain weight per plant and leaf sheath color,and significantly positively correlated with bristle length and grain color.The results of principal component analysis showed that the cumulative contribution rate of the first eight principal components was 80.643%,which could be used to express most of the information of millet protein content and agronomic traits. All the foxtail millet cultivars were divided into four categories by cluster analysis.The first group was bred cultivars,which had the smallest main stem length,node number of main stem and bristle length,and the largest diameter of main stem,showing lodging resistance potential.The second group mainly consisted of landraces,which had the highest protein content. The main panicle length and grain weight per plant were the highest in the third group. The fourth group was mainly composed of bred cultivars with the highest main stem length,node number of main stem and panicle weight per plant. In the future,more attention should be paid to the utilization of the landraces with low main stem length,panicle weight per plant,and grain weight per plant during the breeding of foxtail millet cultivars with high protein content.

Key words: Foxtail millet, Agronomic traits, Protein content, Correlation analysis

中图分类号: